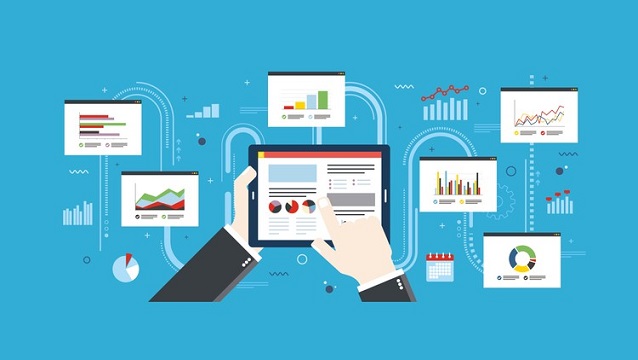
In today’s data-driven world, organizations are inundated with vast amounts of information. To make sense of this data and derive actionable insights, dashboard development has emerged as a crucial discipline. Dashboards serve as visual portals that transform complex data into easily understandable and actionable visualizations. In this comprehensive article, we delve into the world of dashboard development, exploring its importance, key components, design principles, development process, and real-world applications.
The Importance of Dashboard Development
Dashboard development bridges the gap between data and decision-making. Dashboards empower users to analyze, interpret, and act upon data trends, patterns, and metrics in real time. By presenting information visually, dashboards enhance communication, enable informed decision-making, and promote transparency within organizations. Whether monitoring business performance, tracking key metrics, or analyzing market trends, effective dashboard development is essential for leveraging data to drive success.
Key Components of Effective Dashboards
- Data Visualization: Dashboards employ a variety of visual elements such as charts, graphs, tables, and maps to effectively convey information and insights.
- Interactivity: Interactive features like filters, drill-down options, and tooltips allow users to explore data and tailor their experience.
- Real-time Data: Dashboards often integrate real-time or near-real-time data updates, ensuring users have access to the latest information.
- KPIs and Metrics: Dashboards focus on presenting key performance indicators (KPIs) and critical metrics relevant to specific goals and objectives.
- User Experience (UX): Thoughtful design ensures a user-friendly experience, with intuitive navigation, clear labeling, and a logical flow of information.
Design Principles for Dashboard Development
- Clarity and Simplicity: Keep the design clean and concise to avoid overwhelming users. Use clear labels, minimal color palette, and organized layouts.
- Consistency: Maintain a consistent design language with uniform fonts, colors, and icons to create a cohesive and visually pleasing dashboard.
- Hierarchy and Organization: Arrange information logically, ensuring that the most important data is prominently displayed and easy to locate.
- Data-Driven Design: Choose appropriate chart types and visualization methods that best represent the data and aid in conveying insights.
- Responsive Design: Develop dashboards that are responsive and adaptable, ensuring a seamless experience across different devices and screen sizes.
The Dashboard Development Process
- Requirement Gathering: Collaborate with stakeholders to define the dashboard’s objectives, target audience, and specific data requirements.
- Data Source Integration: Connect the dashboard to relevant data sources, whether databases, APIs, spreadsheets, or other systems.
- Design and Visualization: Design the layout, select appropriate visualization techniques, and arrange the data to tell a coherent and meaningful story.
- Interactivity and Filters: Implement interactive elements like filters and drill-down capabilities to enable users to explore data further.
- Testing and Refinement: Rigorously test the dashboard’s functionality, performance, and responsiveness. Collect user feedback and iterate as needed.
- Deployment and Training: Deploy the dashboard to users, provide necessary training, and ensure ongoing support and updates.
Real-World Applications of Dashboards
- Business Intelligence: Dashboards empower executives and managers to monitor business performance, analyze sales data, track marketing campaigns, and optimize operations.
- Financial Analysis: Financial dashboards offer insights into revenue, expenses, cash flow, and profitability, aiding in budgeting and financial planning.
- Supply Chain Management: Dashboards provide visibility into inventory levels, supplier performance, demand forecasting, and logistics tracking.
- Healthcare Analytics: Healthcare professionals use dashboards to track patient outcomes, manage medical resources, and analyze clinical data.
- Educational Institutions: Dashboards assist educational institutions in monitoring student performance, analyzing enrollment data, and improving educational outcomes.
Conclusion
Dashboard development is a pivotal discipline that transforms raw data into actionable insights. By presenting complex information through intuitive visualizations, dashboards enable organizations to make informed decisions, identify trends, and respond to challenges in real time. The process involves a careful balance of design, data visualization, and user experience to create impactful and user-friendly dashboards. In an era where data is a strategic asset, effective dashboard development is a cornerstone for driving organizational success, fostering data-driven decision-making, and achieving a competitive edge in a rapidly evolving business landscape.

